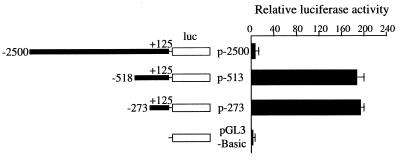
Figure 7.
The human PBP promoter activity. The schematic diagram on the left represents each deletion construct of the PBP gene (dark box) fused into the upstream region of the luciferase gene (luc, white box), with variable 5′-ends to the +125 nucleotide relative to the transcription start site. Each construct was transiently transfected into CV-1 cells. The promoter activity is expressed as fold induction relative to the activity of promoterless pGL3-Basic. The data are the mean ± standard error of triplicate determinations. A repressor region is located between bp −2,500 and −518, 5′-of the PBP transcription start site.

