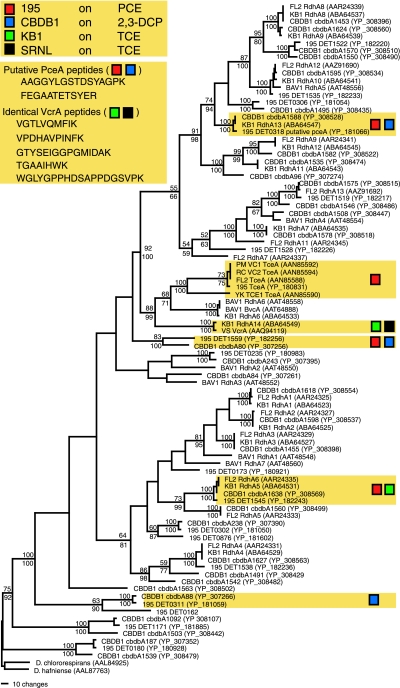
FIG. 3.
Parsimony amino acid tree showing relationships among previously described RDases from strains 195, CBDB1, KB1, BAV1, FL2, and VS and three individual Dehalococcoides RDases from VC- and TCE-dechlorinating strains. Shaded boxes indicate groups identified by proteomic analyses (in tree) and identical putative PceA and VcrA peptides detected in two or more cultures. Bootstrap proportions used to estimate the relative confidence scores in phylogenetic groups were determined using parsimony (values above nodes) and neighbor-joining (values below nodes) methods.

