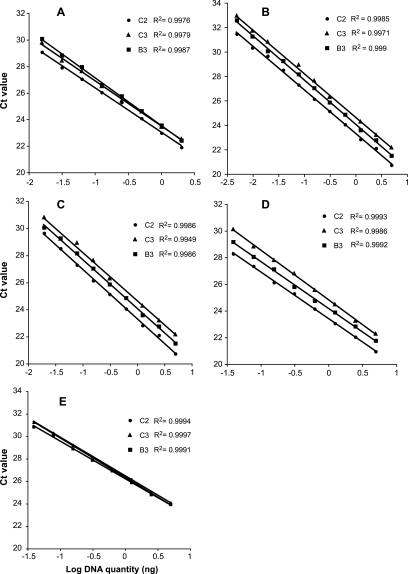
FIG. 2.
Results of real-time quantitative PCR showing linear regressions of the cycle threshold (CT values) and the log concentration of genomic DNA of G. intraradices isolates B3, C2, and C3. The analysis was performed with primers amplifying all previously found variants of the BiP gene and pseudogenes (A); ribosomal genes 18S (B), 5.8S (C), and 25S (D); and Rad15 (E). Real-time quantitative PCR was also performed on Rad32, but the data are not shown as they showed exactly the same pattern as that of Rad15. For all real-time quantitative PCR experiments, two replicate amplifications for each isolate were performed. Data points shown in the graphs represent the average CT value of the two replicates.

