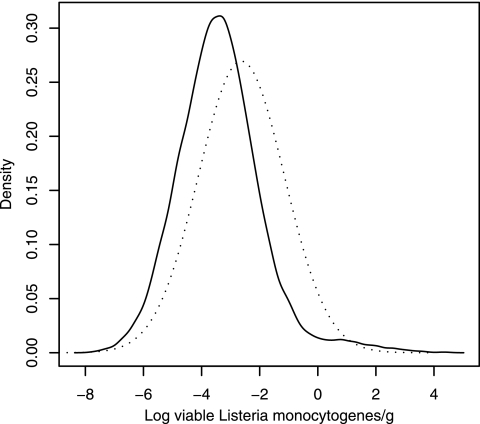
FIG. 2.
Density of log concentrations (expressed as log viable L. monocytogenes organisms per gram) of fresh unprocessed and minimally processed vegetables with L. monocytogenes determined by a normal distribution (dotted line) with an S value of 1.48 log viable L. monocytogenes organisms/g [corresponding to an α value of 0.09% of samples with log(d) counts higher than 2 log viable L. monocytogenes organisms/g], or predicted by a mixture model (solid line).

