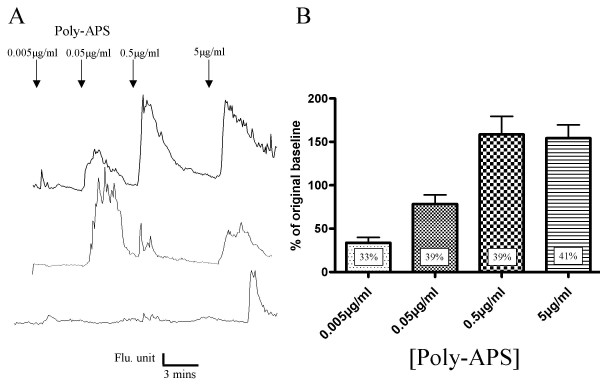
Figure 6.
Poly-APS evoked increases in intracellular Ca2+. A) Example traces from individual neurones exposed to different concentrations of poly-APS during the same Ca2+ imaging experiment. Three different levels of response to poly-APS are seen. The top trace shows the most typical responses. B) Bar chart showing relative increases in intracellular Ca2+ in response to increasing concentrations of poly-APS sampled from a total of 106 neurones. Data shows trend for dose-response relationship (** = P < 0.01 ** = P < 0.001). Percentage values are the % of neurones responding to each concentration of poly-APS.

