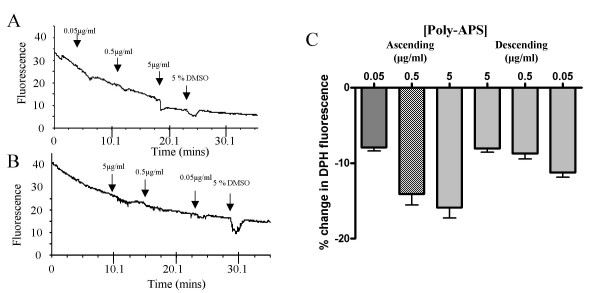
Figure 9.
Cumulative dose-response relationships showing the actions of poly-APS on membrane fluidity. A) Mean record of changes in fluorescence (membrane fluidity, n = 15 from a single experiment) in response to increasing concentrations of poly-APS (2 mins application per concentration). The change in density is partially reversible on washing. B) Mean record of changes in fluorescence in response to decreasing concentrations of poly-APS (starting with the highest 5 to 0.05 μg/ml, n = 8 from a single experiment). C) Bar chart showing the mean responses to poly-APS (n = 103) when the order of application of different concentrations of poly-APS was varied. Regardless of the order of application, there is a trend for an increase in % change in membrane fluidity.

