
Figure 2.
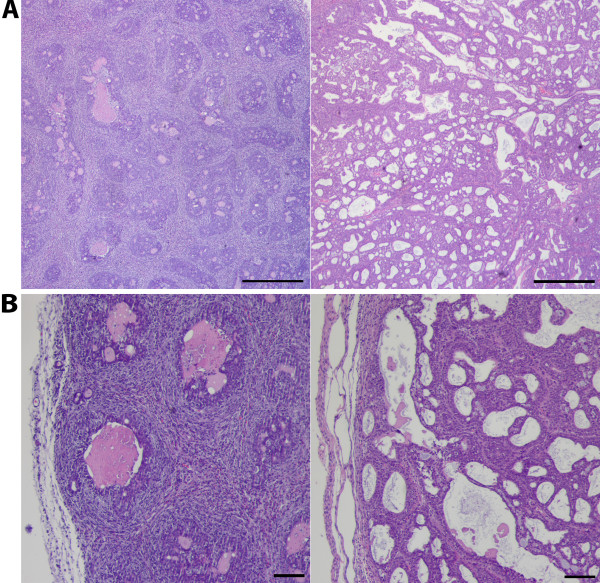
Examples of eosin-hematoxylin stained tumor-tissue of the central (A) and peripheral (B) part of the mammary tumor in control (left) and during hyperoxic treatment (right, 1 bar, pO2 = 1.0). The images under A are scaled to the same magnification (× 4) and the images under B to the same magnification (× 10). Scale bar indicate 500 μm (A) and 100 μm (B).