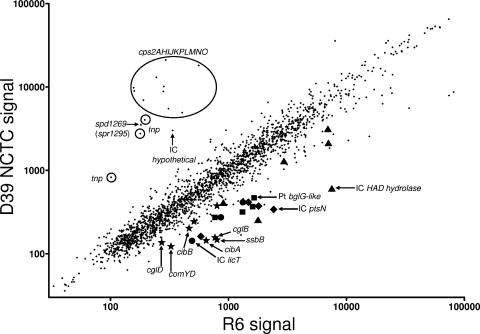
FIG. 4.
Microarray analysis of relative transcript amounts in strains D39 (NCTC) and R6 grown exponentially in BHI. Microarray analyses were performed as described in Materials and Methods. A representative log-scale scatter plot of relative transcript amounts is shown, and fold changes and Bayesian P values for transcripts changing at least 1.9 are listed in Table S6 in the supplemental material. Genes comprising the capsule locus are circled. Symbols indicate coregulated gene clusters as follows: stars, competence-induced genes (cibBC [allolysis], single-strand binding protein [ssb], and cglABCD comYD [peptioglycan-spanning structural proteins]); circles (spd0501 to spd0503; spr0504 to spr0506), genes coregulated with licT (spd0501; spr0504); diamonds (spd0559 to spd0562; spr0562 to spr0565), genes coregulated with ptsN (spd0559; spr0562); squares (spd1958 to spd1961; spr1937 to spr1940), genes coregulated with a BglG-family transcriptional regulator (spd1961; spr1940); triangles (spd1029 to spd1034; spr1052 to spr1057), genes coregulated with an HAD superfamily hydrolase (spd1034; spr1057). IC, mutation in upstream intercistronic region; Pt, point mutation within gene coding sequence. See the text for additional details.

