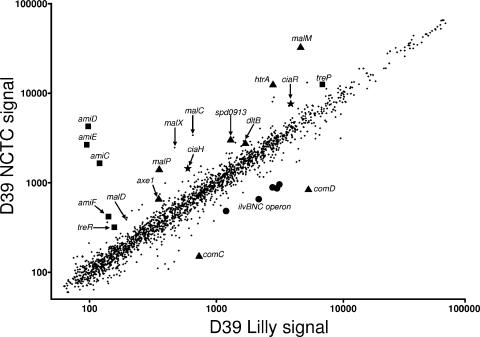
FIG. 6.
Microarray analysis of relative transcript amounts in strains D39 (NCTC) and D39 Lilly) grown exponentially in BHI. Microarray analyses were performed as described in Materials and Methods. A representative log-scale scatter plot of relative transcript amounts is shown, and the fold changes and Bayesian P values for transcripts changing at least 1.8-fold are listed in Table S7 in the supplemental material. Symbols are as follows: squares (spd1664 to spd1670), genes partially or completely deleted in D39 (Lilly); circles (spd0404 to spd0408), ilvBNC gene cluster likely regulated to compensate for deletion of amiCDEF; stars, ciaRH two-component signal transduction system; triangles, genes regulated in a “cia-on” mutant (74).

