
FIG. 4.
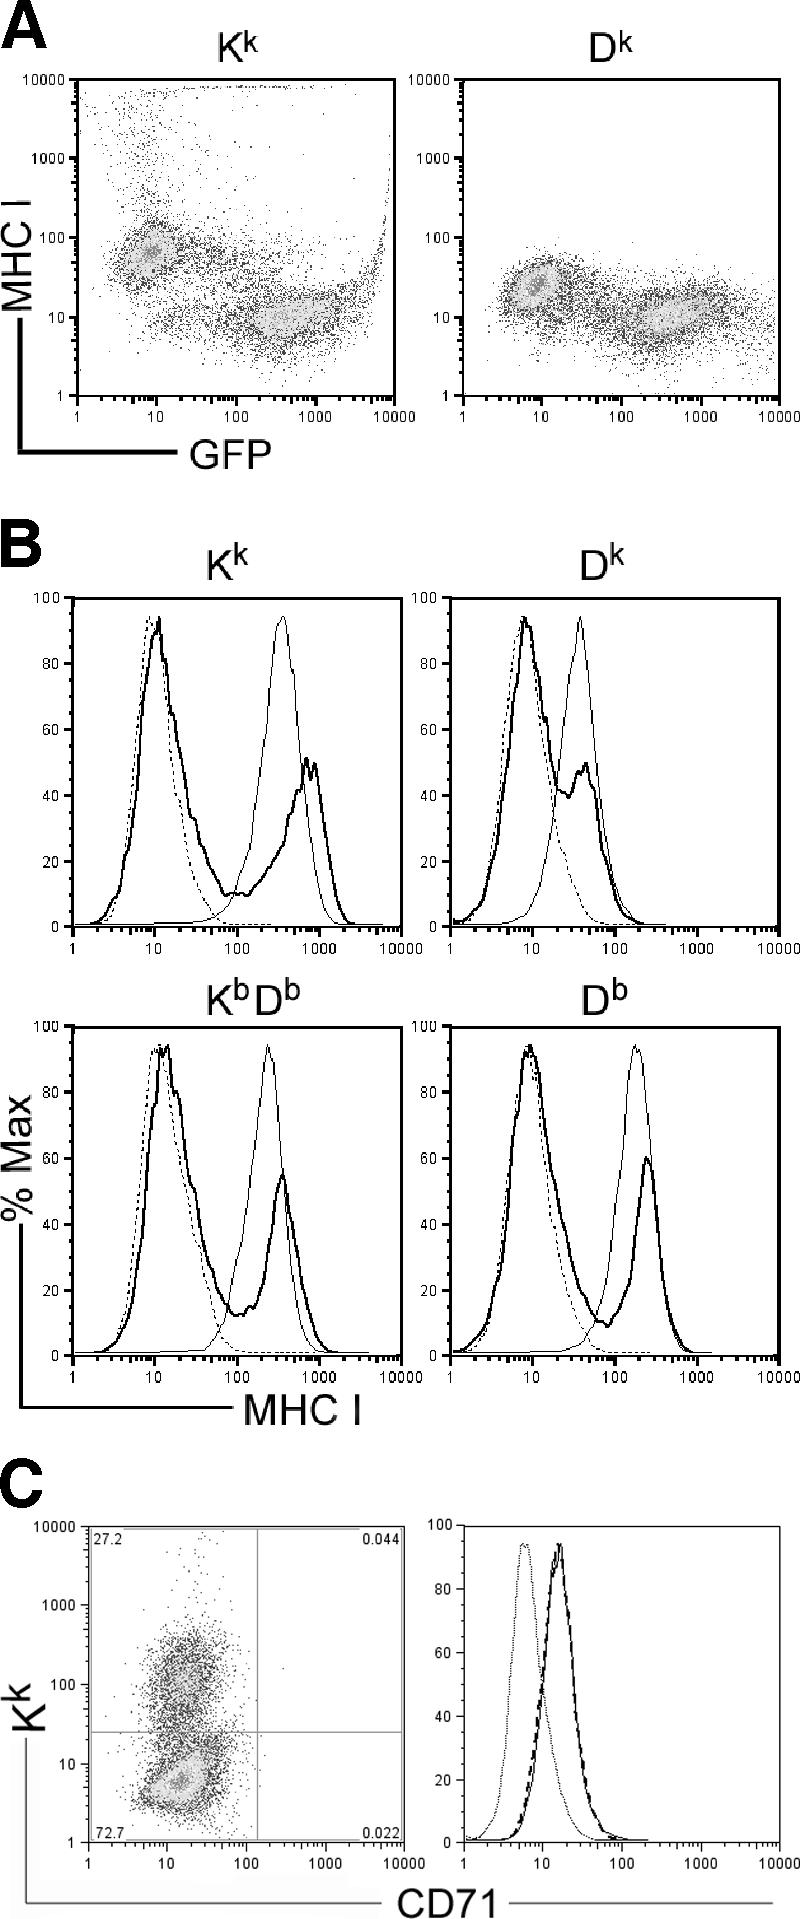
MCMV downregulation of H-2k and H-2b class I proteins on L929 cells and primary (C57L × MA/My)F1 MEFs. (A) Shown is a representative dot plot of H-2k class I protein levels on L929 cells by 24 h after infection with a MCMV-Δm157 reporter virus (MOI = 10). (B) Histograms of MHC class I protein levels on (C57L × MA/My)F1 MEFs (broken line), IFN-γ-induced (20 U, 24 h) (C57L × MA/My)F1 MEFs (thin line), and IFN-γ-induced (C57L × MA/My)F1 MEFs (bold line) infected with GFP-expressing MCMV (MOI = 4) assessed by use of flow cytometry at 12 h postinfection are shown. (C) CD71 cell surface staining on Kk high (thin line) and Kk low (broken line) IFN-γ-induced (C57L × MA/My)F1 MEFs infected with wild-type K181 (MOI = 4). Control Ig staining (thin dotted line) is also shown.