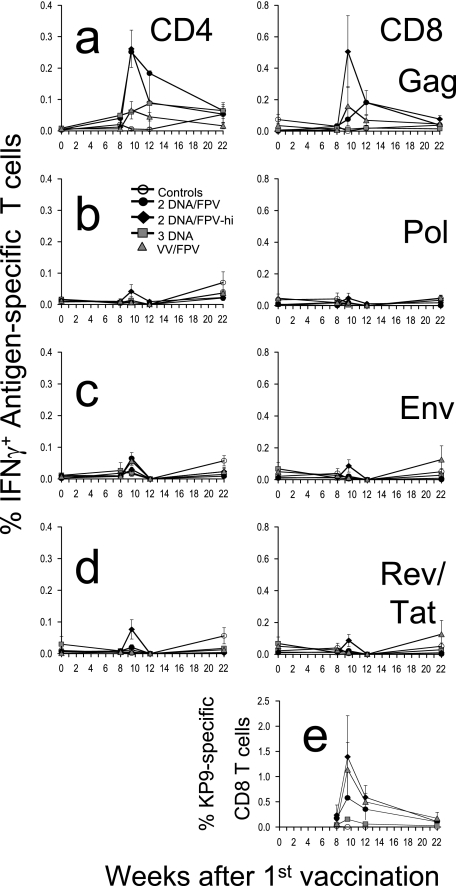
FIG. 1.
Time course of mean cellular immune responses and standard error following vaccination. Groups of macaques were immunized with two-DNA/FPV-low-dose FPV (black circles), two-DNA/FPV-high-dose FPV (black triangles), three-DNA (gray squares), VV/FPV (gray triangles), or control vaccines (open circles) as shown in Table 1. (A to D) CD4 and CD8 T-cell responses are shown in the left and right panels, respectively, in response to stimulation with SIV Gag 15-mer peptide pool (A), SIV Pol 15-mer peptide pool (B), HIV-1 subtype AE Env 15-mer peptide pool (C), or a combined pool of HIV-1 subtype AE Tat and Rev 15-mer peptide pools (D). (E) CD8 T-cell responses to the SIV Gag epitope KP9 were measured in the subset of macaques that were Mane-A*10+ by MHC tetramer staining.

