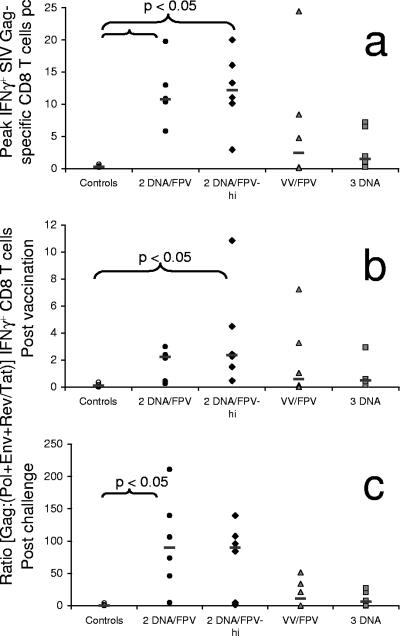
FIG. 5.
Immunodominant Gag cytotoxic T-lymphocyte responses postchallenge (pc). (A) Peak Gag-specific CD8 T-cell responses postchallenge are shown for each animal in each vaccine group. (B and C) Gag immunodominance (measured as the ratio of Gag to [Env plus Pol plus Tat/Rev] specific CD8 T-cell responses) for each animal in each vaccine group after vaccination (mean, weeks 1.5 to 14 post-final vaccination) (B) and after challenge (mean, weeks 1 to 11) (C). The P values for differences between vaccine groups were determined using Dunn's multiple comparison posttest to a Kruskal-Wallis ANOVA.

