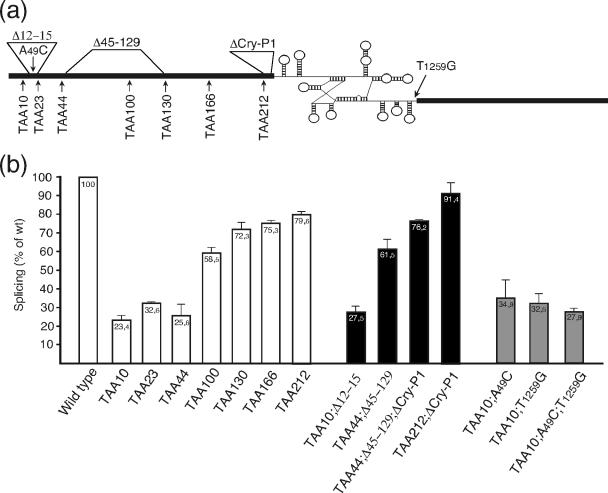
FIG. 3.
Effect of stop codons in the upstream exon on splicing of the nrdB intron. (a) Positions of inserted stop codons, mutations, and deletions in the T4 nrdB gene. Thick lines represent exons. The intron is indicated with a schematic secondary fold. (b) Efficiency of nrdB splicing in the different constructs. Bars display the amount of spliced versus unspliced product of stop codon constructs (white) and those with deletions (black) and point mutations (gray) relative to the wild-type pBS5 level. Numbers are averages from two to five independent experiments. Error bars show the standard error of the mean.

