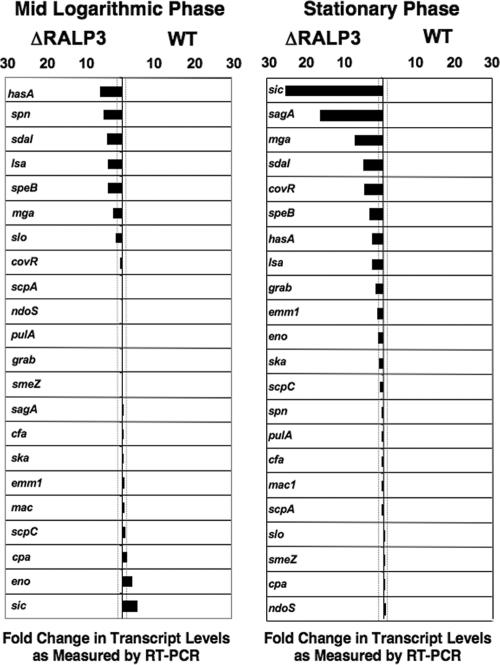
FIG. 3.
Comparison of transcript levels in ΔRALP3 mutant versus WT M1 GAS (graphic depiction of RT-PCR data derived from Fig. 2B). Bars extending to the left indicate transcript levels higher in the ΔRALP3 mutant; bars extending to the right indicate transcript levels more highly expressed in the WT strain. Dotted lines demarcate a cutoff ratio of 2.0.

