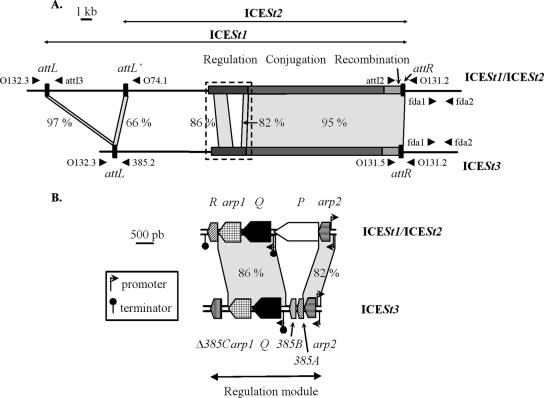
FIG. 1.
Comparison of ICESt1/ICESt2 and ICESt3 maps. (A) Location of the recombination, conjugation, and regulation modules and the recombination sites on the ICESt1/ICESt2 and ICESt3 maps. The recombination sites are indicated by solid rectangles and are magnified. The schematic localizations and orientations of oligonucleotides used for PCRs are indicated by arrowheads. The following primer pairs were used for amplification of fragments containing the recombination sites resulting from ICE excision: primers O131.2 and O132.3 (attB from ICESt1 and ICESt3), primers attI2 and attI3 (attI from ICESt1), primers attI2 and O74.1 (attI′ from ICESt2), and primers O131.5 and 385.2 (attI from ICESt3). The fda1-fda2 primer pair was used for amplification of an fda internal region. The dotted rectangle indicates the area shown in panel B. (B) Map of regulation modules of ICESt1/ICESt2 and ICESt3. ORF designations beginning with “orf” are abbreviated with the corresponding letter or name. The locations and orientations of ORFs and truncated ORFs (Δ385C) belonging to the regulation modules are indicated by arrow boxes. The angled arrows and the lollipops indicate the putative promoters and rho-independent transcription terminators deduced from in silico analyses. The gray areas join closely related modules and att sites belonging to the ICEs (>65% nucleotide identity); the levels of identity are indicated. The close relationships between short sequences and insertion elements are not shown.

