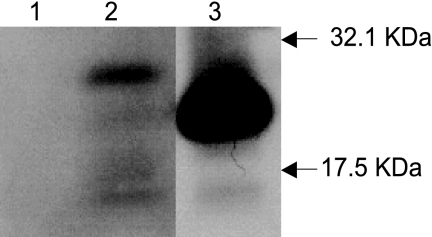
FIG. 4.
Western blot analysis of the expression of R. typhi SPase II in E. coli Top10 cells. Total proteins from E. coli cells carrying the appropriate plasmid were probed with anti-HisG monoclonal antibody. Lane 1, total proteins from E. coli Top10/pTrcHisA; lane2, total proteins from E. coli Top10/pTrcHisRTlspA127; lane3, total proteins from E. coli Top10/pTrcHisEClspA7. Arrows indicate the sizes of Bio-Rad Kaleidoscope prestained marker bands (32.1 and 17.5 kDa). The minor bands below the 17.5-kDa bands in lanes 2 and 3 may have resulted from the degradation of recombinant SPase II or nonspecific binding in the total proteins.

