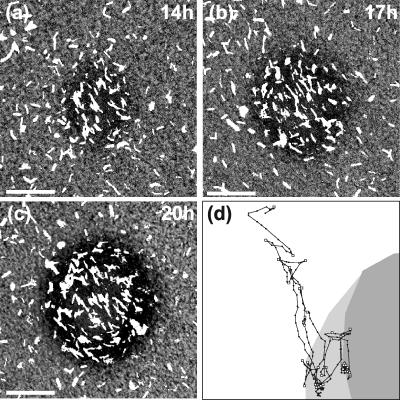
FIG. 1.
Growth of a fruiting body, showing the distribution of cells. (a to c) Different stages of formation of the same fruiting body. Approximately 1/50 of the cells are labeled with GFP; they appear as white regions on the image. These images are taken from the sequences used to compute the motion parameters of individual cells. A movie constructed from the entire sequence, along with the corresponding computational movies, can be downloaded from the supplemental material. Bars, 20 μm. (d) Example of an individual cell track for a representative cell. The fruiting body shapes at the beginning and at the end of the tracking period are shown as shaded areas: the dark gray indicates its initial shape, and light gray indicates its final shape. Locations of the cell on each frame are shown as dots; the frames are separated by 30-s time intervals. The cell started the motion at the top left corner and finished at the bottom point of the track. Automatically determined reversal points are shown with squares. The reduction in the distances between cell positions in consecutive frames shows the velocity decrease.

