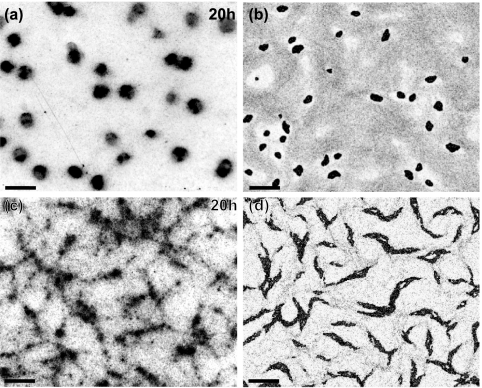
FIG. 2.
Comparison of experimentally observed and computed fruiting bodies. (a) Low-resolution bright field image of formed fruiting bodies. The image is taken 20 h after the beginning of starvation. (b) Corresponding image computed from the model. The image was taken at approximately 10 h of cell time (i.e., the time of the simulated cells, as opposed to computer time) after the beginning of the simulation corresponding to the time for panel a. (c) Image of the ΔfrzCD mutant under the same conditions as described for panel a. (d) Corresponding computed image. Bars, 200 μm.

