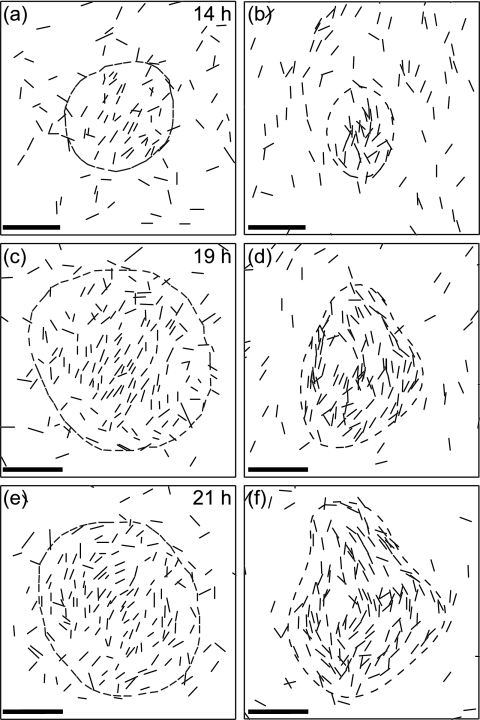
FIG. 3.
Orientations of cells inside a typical fruiting body at different times. Left panels show the experimental data for the same fruiting body, and right panels show the corresponding frames in the simulations. The time of development is indicated on the panels. Each cell shown (1 out of 50, as in Fig. 1) is represented by a line segment of the actual cell length both on the experimental and computed images. Dashed lines are the fruiting body boundaries, defined as a line of equal total density determined from DIC images on the experimental figures, and from total density on the simulated figures. In the earliest aggregates the cells are mostly coaligned; they acquire tangential orientations later as the cell density on the periphery becomes higher than in the interior of the nascent fruiting body. Bars, 20 μm.

