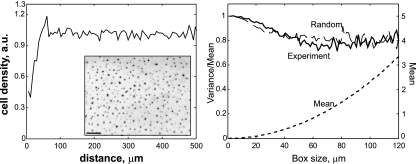
FIG. A2.
Test for randomness of fruiting body distribution. (Left) Radial density distribution of experimentally observed fruiting bodies (for a sample containing ∼1,000 fruiting bodies). The initial increase is determined by the size of the fruiting bodies and the depletion region around each one. The approximately constant dependence and absence of oscillations indicate the absence of a fundamental length scale or wavelike distribution of the dense regions, characteristic of patterns based on Turing instabilities. (Inset) Fragment of a plate with multiple fruiting bodies. Bar, 200 μm. (Right) Variance to mean ratio for the fruiting bodies and for the same number of randomly distributed points with the excluded area (circle of radius 15 μm, with mean distance between fruiting bodies of 49 μm).

