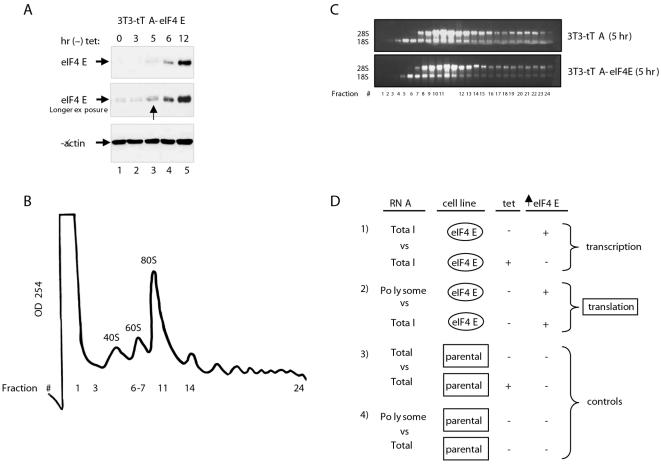
Figure 1. Induction of eIF4E in NIH 3T3 fibroblast cells and microarray analysis.
A) eIF4E overexpression was induced by culturing 3T3-tTA-eIF4E cells in a tetracycline free medium. Immunoblots for eIF4E and β-actin were performed. B) A characteristic fractionation profile of 3T3-tTA and 3T3-tTA-eIF4E cells is depicted. Absorbance at 254 nm was monitored. C) Fractions from 3T3-tTA and 3T3-tTA-eIF4E (induced) cells were analyzed on a denaturing agarose gel to visualize the 18S and 28S rRNAs. D) The experimental design used for microarray analysis is shown.

