
Figure 3.
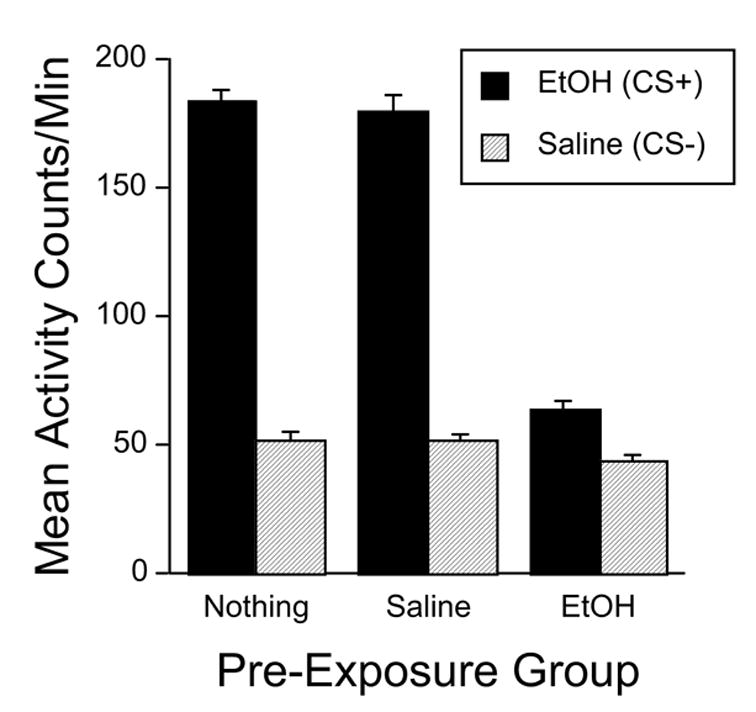
Mean (+ SEM) activity counts per minute in Experiment 2 averaged across all four CS+ (solid bars) and CS− (hatched bars) conditioning trials for each pre-exposure group. All mice received ethanol (2 g/kg) on CS+ trials and saline on CS− trials. Additionally, subjects were divided into three pre-exposure groups. The Saline (n = 50) and EtOH (n = 52) groups received an injection of saline or ethanol, respectively, 5 min before each CS+ trial. The Nothing group (n = 47) did not receive a pretreatment.