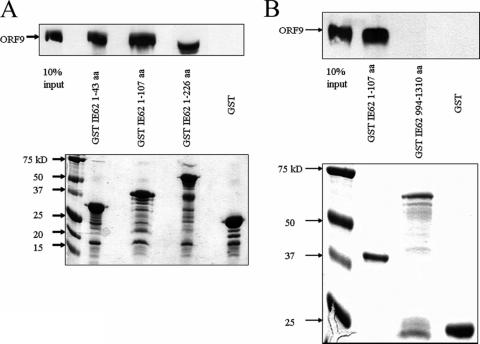
FIG. 4.
Mapping of the minimal region of IE62 that interacts with the ORF9 protein. Results from protein pull-down assays using GST-IE62 fusions showing the presence or absence of the ORF9 protein in samples eluted from glutathione-Sepharose beads. (A) N-terminal IE62 fragments. (B) C-terminal IE62 fragments. The lower portion of each panel is a Coomassie gel showing the levels of the GST-IE62 fusions and GST bound to the beads in these assays. Arrows in upper panels indicate the position of the intact ORF9 protein.

