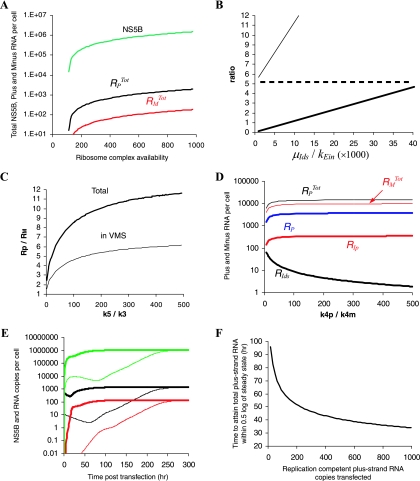
FIG. 2.
Simulation of subgenomic HCV RNA replication in Huh-7 cells. To explore the impact of each unknown parameter on subgenomic HCV kinetics, from time of transfection (t = 0) to steady state, we varied one or more chosen parameters within a given range, while all other parameters were maintained fixed as follows: k1 = 80 h−1 molecule−1, kPin = 0.2 h−1, kPout = 0.2 h−1, kEin = 1.3 × 10⁻⁵ h−1, kc = 0.6 h−1, k2 = 100 h−1, k4p = k4m = 1.7 h−1, k3 = 0.02 h−1 molecule−1, k5 = 4 h−1 molecule−1, μIp = 0.04 h−1, μE = 0.04 h−1, μpcyt = 10 h−1, μp = 0.07 h−1, μds = 0.06 h−1, μIds = 0.13 h−1, μEcyt = 0.06 h−1, μTc = 0.015 h−1, RiboTot = 700 ribosome complexes, and RPcyt(0) = 500 plus-strand RNA copies. (A) Within a range of 1 to 1,000 available ribosome complexes per cell (RiboTot), the model reached steady-state characteristics when 500 < RiboTot < 1,000. We found that the steady-state HCV NS5B polymerase level (green line) increases with higher RiboTot numbers. The total plus- and minus-strand RNAs at steady state are shown as black and red lines, respectively. (B) We chose kEin and μIds within the ranges 5 × 10⁻⁶ to 2 × 10⁻⁴ h−1and 0.01 to 0.9 h−1, respectively. We found that the ratio (RP + RIp + Rds + RIds)/(RPcyt + Tc), which is the ratio of total plus-strand RNAs inside and outside of the VMS (thick line), and the ratio of total plus-strand RNA to total minus-strand RNA (RPTot/RMTot, thin line) increase with the ratio μIds/kEin between the rate of replicative intermediate degradation and the rate of polymerase transport into the VMS. To obtain a 1:1 ratio of (RP + RIp + Rds + RIds)/(RPcyt + Tc) and a 10:1 ratio of RPTot/RMTot, the ratio μIds/kEin needs to be about 104. A ratio of ∼6 of total plus-strand RNA to total minus-strand RNA in VMS is found with many different μIds and kEin rates (dashed line). (C) We chose k5 and k3 within the ranges 0.8 to 4.0 h−1 and 0.004 to 0.02 h−1, respectively. The ratio of total plus-strand RNA to total minus-strand RNA increases with the ratio k5/k3 of formation rates of minus-strand to plus-strand replication complexes. While k5/k3 = 1 does not allow for a 10:1 total plus-strand-to-minus-strand asymmetry (thick line), and 6:1 total plus-strand-to-minus-strand asymmetry in VMS (thin line), k5/k3 ∼ 200 will. (D) We checked whether the total plus-strand-to-minus-strand asymmetry can be generated with different synthesis rates of plus- and minus-strand RNA, i.e., k4p > k4m. We assumed the same formation rates (k5 = k3 = 0.02 h−1) of plus-strand and double-strand replicative intermediate complexes (RIp and RIds, respectively). Interestingly, although 50- to 500-fold faster synthesis rates for the plus-strand RNA than for the minus-strand RNA generate larger numbers of RIp complexes (thick red line) than of RIds complexes (thick black lines), the total plus-strand RNA (thin black line) is approximately equal to the total minus-strand RNA (thin red line). Free plus-strand RNA (RP) is represented in blue. The curve for Rds superimposes on the curve for RMTot since almost all of the minus-strand RNA is in double-stranded complexes. (E) With 10 subgenomic plus-strand RNAs successfully transfected [RPcyt(0) = 10 per cell (thin lines)], total plus-strand RNA (black line), minus-strand RNA (red line), and NS5B molecules (green line) reach steady state in about 300 h. However, with RPcyt(0) = 500 (thick lines), the steady state is attained in about 50 h. The total plus-strand RNA level at steady state is not affected by different initial RPcyt numbers. (F) We tested how the plus-strand RNA copy numbers (1 to 1,000) at time of transfection, RPcyt(0), affect the time to attain steady state. Only when RPcyt(0) was >7 was a steady state attained, whereas RPcyt(0) at <7 led to elimination of viral RNA (not shown). Higher initial RPcyt numbers leads to faster attainment of steady-state.

