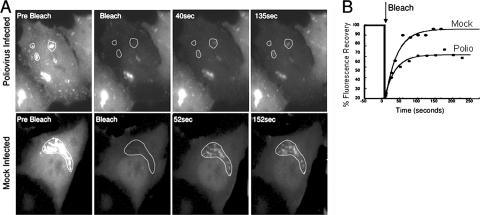
FIG. 2.
Arf1-GFP dynamics in poliovirus-infected HeLa cells. (A) Regions of interest (dotted lines) were selected for photobleaching in cells ∼3 h postinfection. In mock-infected cells the Arf1-GFP-labeled Golgi apparatus was selected. A laser pulse was directed at the selected regions to bleach the fluorescence. Recovery of fluorescence was monitored with low intensity laser light every 5 s. (B) The recovery of fluorescence into the selected regions was quantified and plotted as described in Materials and Methods. Photobleaching was performed on 9 virus-infected and 12 mock-infected cells in two separate experiments. The mean rate of recovery (τ) for control cells was 32 ± 7.5 s−1, and for virus-infected cells it was 28 ± 4 s−1. The mean immobile fraction for control cells was 10% ± 7%, whereas for poliovirus-infected cells it was 35% ± 13%. Representative recovery curves from infected and mock-infected cells are plotted.

