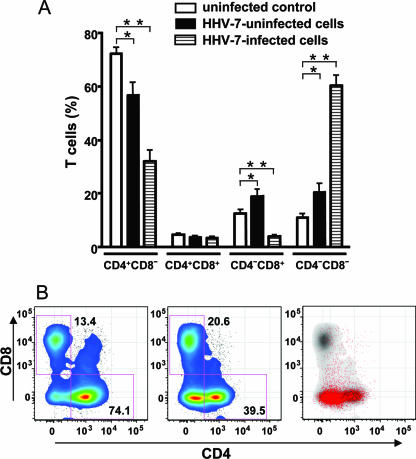
FIG. 4.
Phenotype of HHV-7-infected cells in human lymphoid tissues. Tissue blocks (27 blocks for each condition from each donor) were inoculated with HHV-7 and cultured for 12 days. Cells isolated from these blocks and from matched uninfected blocks were stained for lymphocytic markers and analyzed with flow cytometry. (A) Distribution of CD4 and CD8 in uninfected tissues and in matched HHV-7-infected tissue. Bars: □, T cells in uninfected tissue; ▪, uninfected T cells in HHV-7-infected tissue; ▤, HHV-7-infected T cells in infected tissue. Each bar represents the mean ± the SEM for tissues from nine donors. Asterisks denote significant differences: *, P < 10−2; and **, P < 10−3. (B) Bivariate density plot of T (CD3+) cells isolated from HHV-7-infected tissue on day 12 postinfection and stained for lymphocytic markers. Panels: left, distribution of T cells in uninfected tissue; middle, distribution of T cells in HHV-7-infected tissues; right, distribution of HHV-7-infected T cells (red dots) among T cells (gray) in HHV-7-infected tissues. A typical example of experiments with tissues from 10 donors is presented.

