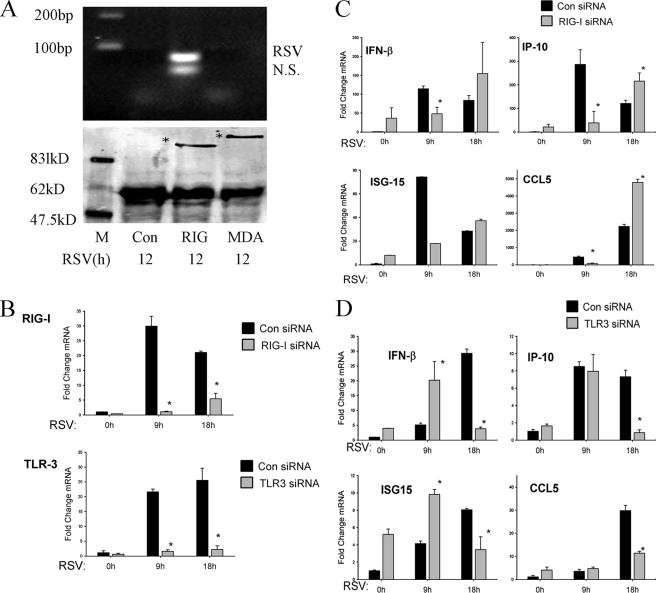
FIG. 2.
RIG-I mediates early innate immune response to RSV infection. (A) RNA helicase UV cross-linking and immunoprecipitation assay. A549 cells were transfected with 2 μg pT1S vector as control (Con), pT1S-FLAG-RIG-I (RIG), or pT1S-FLAG-MDA5 (MDA) for 24 h. Thereafter, cells were infected with RSV for 12 h. UV cross-linking and immunoprecipitation experiments were conducted as described in Materials and Methods. RT-PCR yielded two bands in the sample corresponding to RIG-I immunoprecipitation. The upper band was confirmed as RSV N protein RNA by sequencing (top panel); the bottom band is a nonspecific product (N.S.). Molecular sizes in base pairs (bp) are shown on the left. The bottom panel shows a Western immunoblot of the immunoprecipitates, including RIG-I and MDA5. Specific bands are indicated by asterisks. Molecular sizes are shown on the left. M, marker. (B) A549 cells were transfected with 100 nM of nonspecific siRNA as control (Con), RIG-I siRNA (RIG-I), or TLR3 siRNA (TLR3) for 48 h. Cells were infected by RSV for 0, 9, or 18 h, and total RNA was extracted. QRT-PCR was performed to determine changes in RIG-I (top panel) or TLR3 (bottom panel) expression levels as indicated. *, P is <0.01 compared to control siRNA (Student's t test). (C and D) A549 cells were transfected with control (Con), RIG-I siRNA (RIG-I), or TLR3 siRNA (TLR3) for 48 h and then RSV infected for 0, 9, or 18 h. CCL-5, IP-10, IFN-β, and ISG15 expression levels were determined by QRT-PCR; shown are the changes (n-fold) relative to unstimulated cells transfected with control siRNA (0 h). *, P is <0.05 relative to the corresponding group at the same time point (Student's t test). (C) Results of QRT-PCR of cells transfected with RIG-I siRNA and (D) cells transfected with TLR3 siRNA. Error bars indicate standard deviations.

