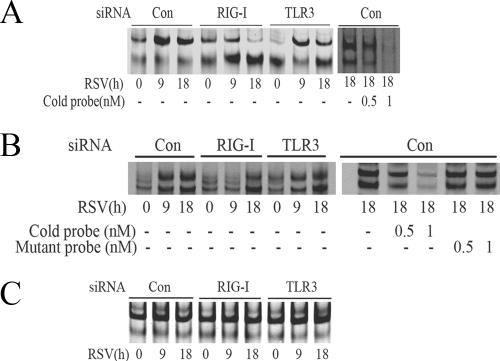
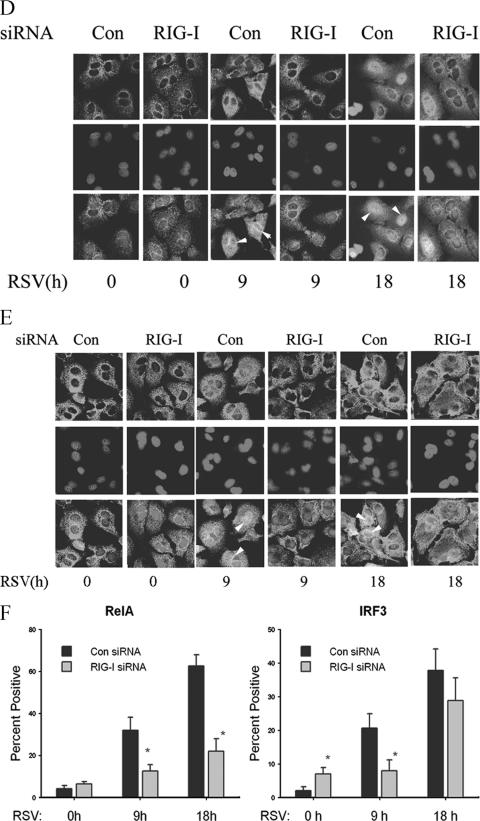
FIG.3.
RSV activates NF-κB and IRF-3 through the RIG-I pathway at the early phase of infection. (A) A549 cells were transfected with 100 nM of nonspecific siRNA as control (Con), RIG-I siRNA (RIG-I), or TLR3 siRNA (TLR3) for 48 h, followed by RSV infection for 9 or 18 h. NE from each siRNA treatment were prepared and assayed by EMSA. Shown are bound complexes on the IRDye 700-labeled κB oligonucleotides visualized by infrared scanning (left panel). A competition experiment was performed using the sample from the control siRNA-treated group that was infected with RSV for 18 h and incubated with 0, 0.5, or 1 nM unlabeled oligonucleotides (right panel). −, none. (B) IRF-3 binding at different times of RSV infection. EMSA was performed on NE using 0.1 nM IRDye 700-labeled ISRE binding site (left panel). A competition experiment with unlabeled probe and mutant probe was conducted (right panel). −, none. (C) OCT-1 binding. EMSA was performed using the same NE, binding 0.1 nM IRDye 800-labeled OCT-1 binding site. (D) A549 cells were transfected with either control (Con) or RIG-I siRNA (RIG-I) for 48 h and then RSV infected for 0, 9, or 18 h. The cells were fixed, incubated with rabbit anti-RelA Ab, and then stained with fluorescein isothiocyanate-conjugated anti-rabbit secondary Ab (top panels). The nuclei were stained with Sytox orange (middle panels). The slides were imaged using confocal microscopy, and colors were merged (bottom panels). Colocalization of RelA and nuclei is shown by light grey. White arrows indicate the cells which had RelA nuclear translocation. (E) A549 cells were treated as in (D), except that rabbit anti-IRF-3 Ab was used. Colocalization of IRF-3 and nuclei is shown by light grey and indicated by white arrows. (F) The percentages of cells with nuclei positive for RelA or IRF-3 at each time point and for each treatment were calculated based on five randomly photographed fields from two independent experiments. Asterisks indicate a significant difference between siRNA groups at the same time point of RSV infection (P < 0.05, Student's test). Error bars indicate standard deviations.


