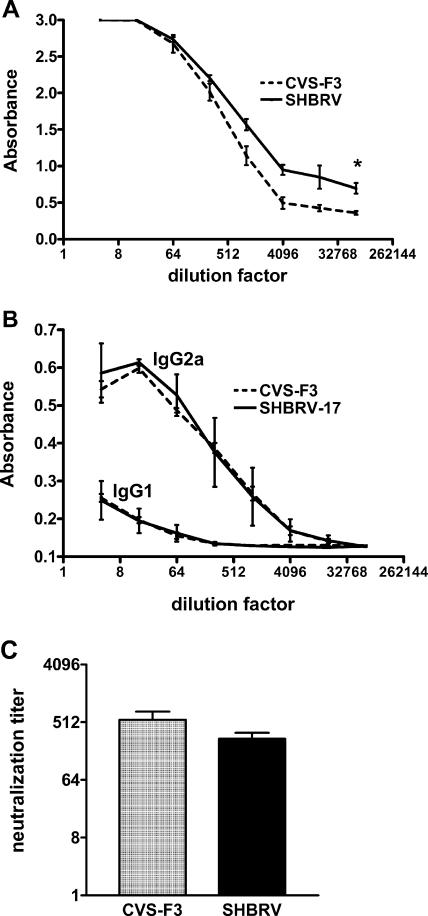
FIG. 3.
RV-specific antibody responses elicited by infection with SHBRV-17 versus CVS-F3. Levels of RV-specific total IgG (A), the IgG1 and IgG2a isotypes (B), and VNA (C) in the sera of CVS-F3- and SHBRV-17-infected mice on day 8 p.i. were assessed by ELISA and rapid fluorescent focus inhibition test, respectively, as described in Materials and Methods. Statistically significant differences between groups, calculated by the paired t test, are denoted by asterisks (P < 0.01, n = 10).

