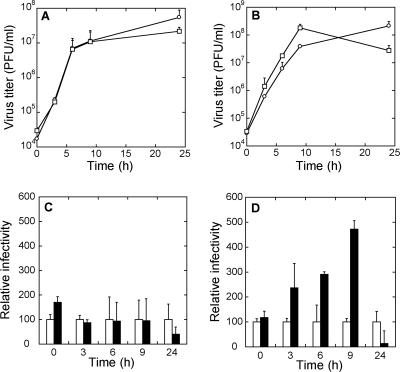
FIG. 4.
Kinetics of extracellular virus production of nonmutated and mutant FMDVs. (A and B) Absolute virus titers at different times after infection. (A) Circles, nonmutated virus; squares, C3007V mutant. (B) Circles, nonmutated virus; squares, C3007V/D3009A mutant. (C and D) Relative infectivity of mutant viruses with respect to the infectivity of the nonmutated virus at different times after infection. The infectivity of the nonmutated virus at each time after infection has been given the reference value of 100. (C) White bars, nonmutated virus; black bars, C3007V mutant. (D) White bars, nonmutated virus; black bars, C3007V/D3009A mutant. Standard deviations are indicated in each case.

