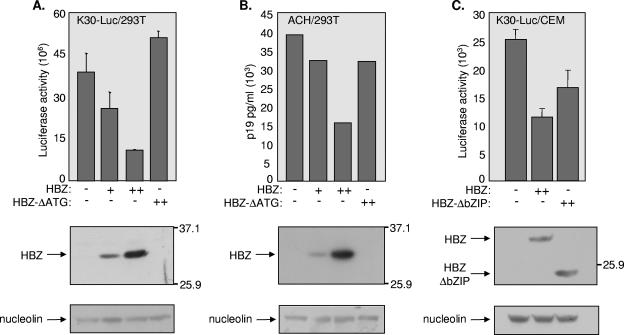
FIG. 1.
Repression of HTLV-1 proviral gene expression by HBZ. (A) HBZ abrogates proviral genome expression. 293T cells were cotransfected with K30-Luc (2 μg), pcDNA-HBZ-MycHis (1 and 5 μg), or pcDNA-HBZΔATG (5 μg) and the β-galactosidase-containing reference plasmid pcDNA-lacZ (2 μg). Luciferase assays were performed 48 h after transfection and luciferase activity was normalized to β-galactosidase activity. Reported values are the average luminescence from three experiments and the standard error is indicated. Expression of HBZ was visualized by Western blot analysis with an anti-Myc antibody (middle panel). Protein standards (in kilodaltons) are indicated at the right. Nucleolin was probed as a loading control (lower panel). (B) HBZ represses virion production. The ACH molecular clone (5 μg), pcDNA-HBZ-MycHis (1 and 5 μg) or pcDNA-HBZΔATG (5 μg), and pcDNA-lacZ (2 μg) were cotransfected into 293T cells. Expression of p19gag was measured 24 h after transfection. The results are representative of three experiments. Expression of HBZ was visualized by Western blot analysis with an anti-Myc antibody (middle panel). Protein standards (in kilodaltons) are indicated at the right. Nucleolin was probed as a loading control (lower panel). (C) HBZ abrogates proviral genome expression in T cells. CEM T cells were cotransfected with K30-Luc (1 μg), pcDNA-HBZ-MycHis (3 μg) or pcDNA-HBZΔbZIP (3 μg), and the β-galactosidase-containing reference plasmid pcDNA-lacZ (1 μg). Luciferase assays were performed 24 h after transfection and luciferase activity was normalized to β-galactosidase activity. Reported values are the average luminescence from three experiments and the standard error is indicated. Expression of HBZ was visualized by Western blot analysis with an anti-Myc antibody (middle panel). Protein standards (in kilodaltons) are indicated at the right. Nucleolin was probed as a loading control (lower panel).

