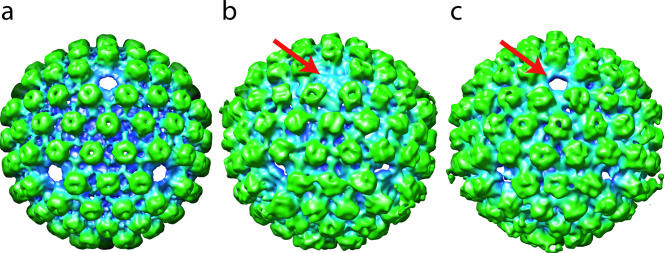
FIG. 2.
Tomographic reconstructions. (a) The icosahedrally averaged map looking along a threefold orientation is similar to that derived from single-particle reconstruction (Fig. 1c). (b) The fivefold-averaged map after orientation of the portal vertex along the positive z axis. The arrow points to the portal density. (c) Fig. 2b is rotated to show the empty vertex opposite the portal (arrow).

