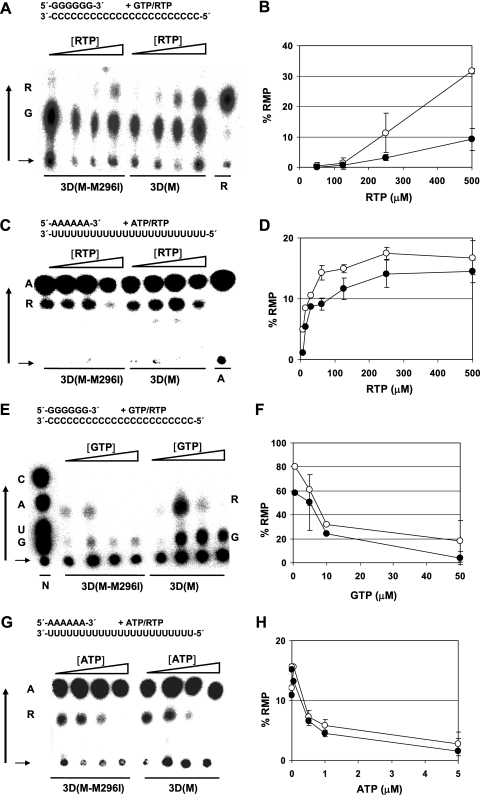
FIG. 5.
Incorporation of RMP relative to that of GMP or AMP by purified FMDV 3D(M) or FMDV 3D(M-M296I) using homopolymeric templates-primers. (A) Incorporation of RMP and GMP using poly(rC)-oligo(dG)15 as the template-primer. The reaction was performed in Mg(CH3COO)2 (15 mM), [α-32P]GTP (1 nM), and increasing concentrations of RTP (50, 100, 250, and 500 μM). Results of thin-layer chromatography of RNase-digested products are shown; the black vertical arrow shows the direction of the migration, and the horizontal arrow indicates the sample application point. The positions of ribavirin monophosphate (R) and GMP (G) are indicated. Ribavirin monophosphate control migration is the product of RMP incorporation at position +1 (from the primer 3′ end) into sym/sub-RNA 5′-GUACGGGCCC-3′, with [α-32P]UTP incorporated at position +2. RNase digestion and nucleotide (nearest-neighbor) analysis were performed as detailed in Materials and Methods. (B) Incorporation of RMP as a function of RTP concentration [○, 3D(M); •, 3D(M-M296I)]. Shown are averages of results from four experiments performed like that whose results are shown in panel A. (C) Incorporation of RMP and AMP using poly(rU)-poly(rA)6 as the template-primer, MnCl2 (10 mM), [α-32P] ATP (1 nM), and increasing concentrations of RTP (62.5, 125, 250, and 500 μM). The results of thin-layer chromatography of RNase-digested products are shown. The positions of ribavirin monophosphate (R) and AMP (A) are indicated; other symbols are as described for panel A. (D) Incorporation of RMP as a function of RTP concentration [○, 3D(M); •, 3D(M-M296I)]. Averages of results from three experiments performed like that whose results are shown in panel C (note the different scales in the ordinates between panels B and D). (E) Incorporation of RMP and GMP using poly(rC)-oligo(dG)15 as the template-primer, MnCl2 (10 mM), RTP (400 μM), and increasing concentrations of [α-32P]GTP (0.5, 5, 10, and 50 μM). The results of hin-layer chromatography of RNase-digested products are shown. The positions of ribavirin monophosphate (R) and GMP (G) are indicated. The N lane shows the position of nucleoside monophosphates. Other symbols are as described for panel A. (F) Incorporation of RMP as a function of GTP concentration [○, 3D(M); •, 3D(M-M296I)]. Shown are averages of results of three experiments performed like that whose results are shown in panel E. (G) Incorporation of RMP and AMP using poly(rU)-poly(rA)6 as the template-primer, MnCl2 (10 mM), RTP (400 μM), and increasing concentrations of [α-32P]ATP (0.05, 0.5, 1, and 5 μM). Results of thin-layer chromatography of RNase-digested products are shown. The positions of ribavirin monophosphate (R) and AMP (A) are indicated. Other symbols are as described for panel A. (H) Incorporation of RMP as a function of ATP concentration [○, 3D(M); •, 3D(M-M296I)]. Shown are averages of results from three experiments performed like that whose results are shown in panel G (note the different scales in the ordinates between panels F and H). Standard deviations of densitometry values are given. Procedures are detailed in Materials and Methods.

