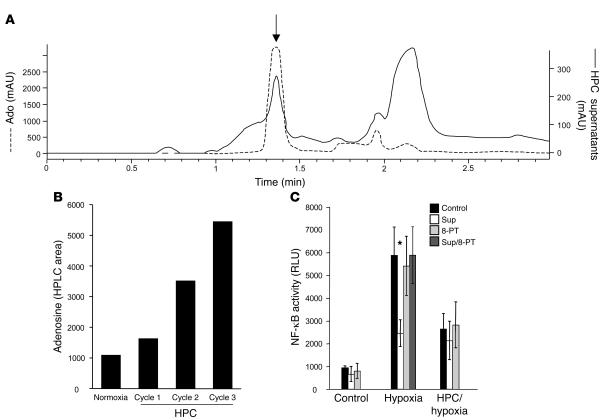
Figure 2. Identification of the HPC soluble factor as Ado.
(A) HPLC tracings of the supernatants from preconditioned cells filtered through 5-kDa-MW cutoff filters (solid line, scale on right) display a retention time peak (arrow) identical to an internal standard of Ado (1 mM; dashed line, scale on left). (B) HPLC area of the peak of the filtered supernatant (as in A), showing an increase in Ado production with each cycle of HPC. (C) Incubation of cells with 8-PT during HPC inhibits the release of soluble factor and thus does not allow naive cells the possibility of inhibiting NF-κB activity (dark gray bars, Hypoxia) compared with incubation with supernatants that were not inhibited with 8-PT (white bars; *P < 0.05 versus hypoxia alone).

