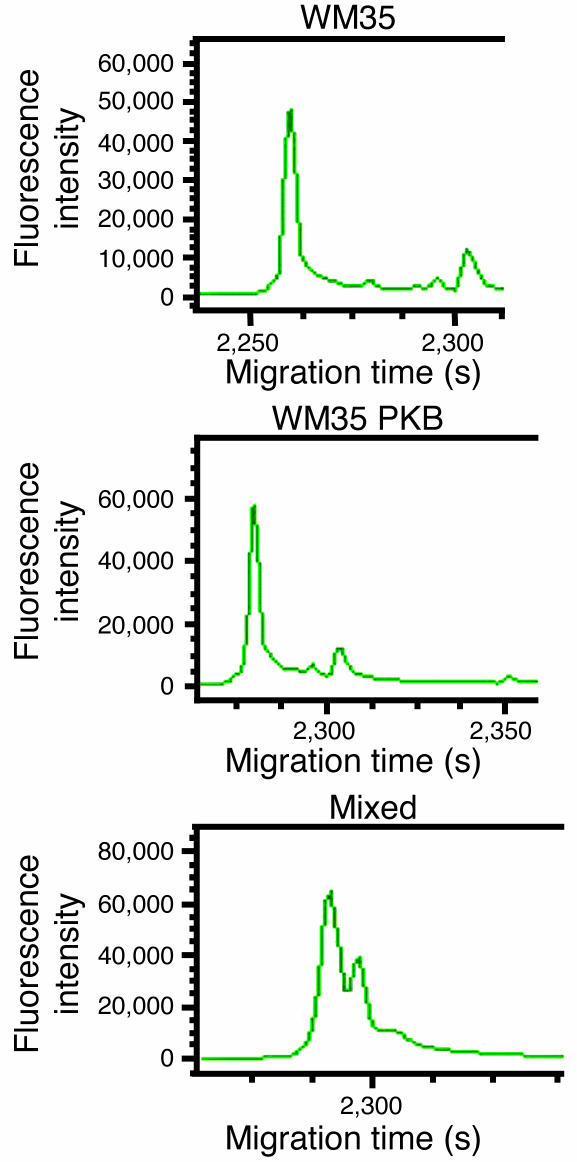
Figure 6. Amplicon 1 TGCE electropherogram tracings for WM35 cells, WM35 PKB cells, and the mixed sample.
Amplicon 1 (spanning mitochondrial positions 16278–148) is a 440-bp fragment that was one of 3 from the 17 total amplicons not subjected to restriction endonuclease treatment, yielding a single peak upon TGCE analysis, as shown for both the WM35 and the WM35 PKB homoduplexes. The mixed sample, however, consisted of a characteristic double peak, suggestive of nucleotide differences between the 2 samples that led to the formation of both homoduplex and heteroduplex species that were resolved from one another in this assay.

