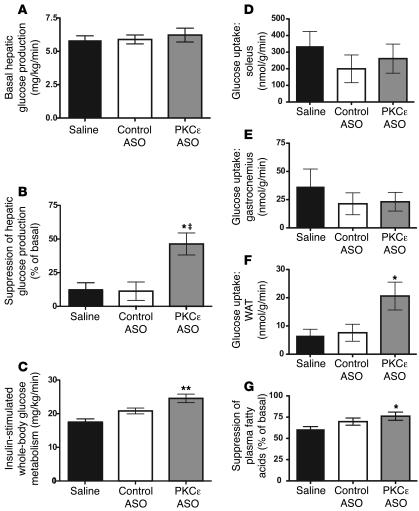
Figure 3. PKCε ASO therapy results in improved hepatic insulin sensitivity and insulin-stimulated adipose glucose uptake.
(A) Basal rate of endogenous glucose production. (B) Percentage suppression of endogenous glucose production during hyperinsulinemic-euglycemic clamping. *P < 0.05 versus saline; ‡P < 0.01 versus control ASO. (C) Rate of insulin-stimulated whole-body glucose uptake. **P < 0.001 versus saline. (D) Soleus 14C-2-deoxyglucose (2-DOG) uptake. (E) Gastrocnemius 2-DOG uptake. (F) Epididymal white adipose tissue (WAT) 2-DOG uptake. *P < 0.05 versus saline. (G) Suppression of plasma fatty acid concentration during hyperinsulinemic-euglycemic clamping. *P < 0.05 versus saline.

