Figure 2.

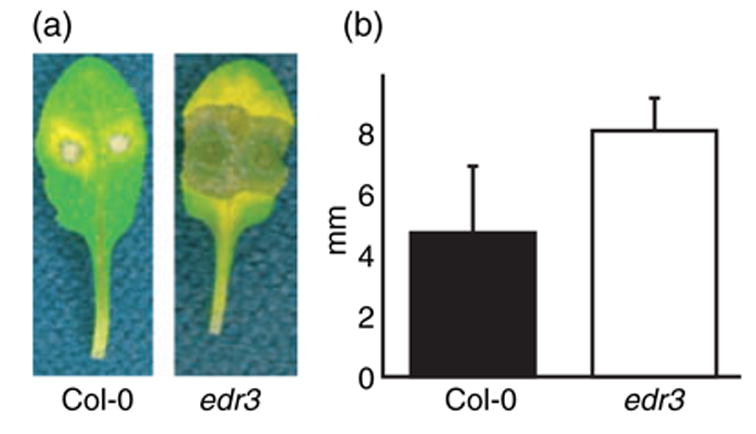
The edr3 mutant displays enhanced susceptibility to B. cinerea
(a) Leaves from wild-type Col-0 and edr3 mutant plants were detached, placed in Petri dishes and inoculated with B. cinerea. Leaves were photographed 3 days after inoculation.
(b) Lesion sizes induced by B. cinerea. Bars represent the mean and standard deviation of values obtained from eight leaves 3 days after infection. The lesion sizes in Col-0 and edr3 are significantly different according to Student’s t-test (P < 0.05). This experiment was repeated twice with similar results.
