
Figure 4.
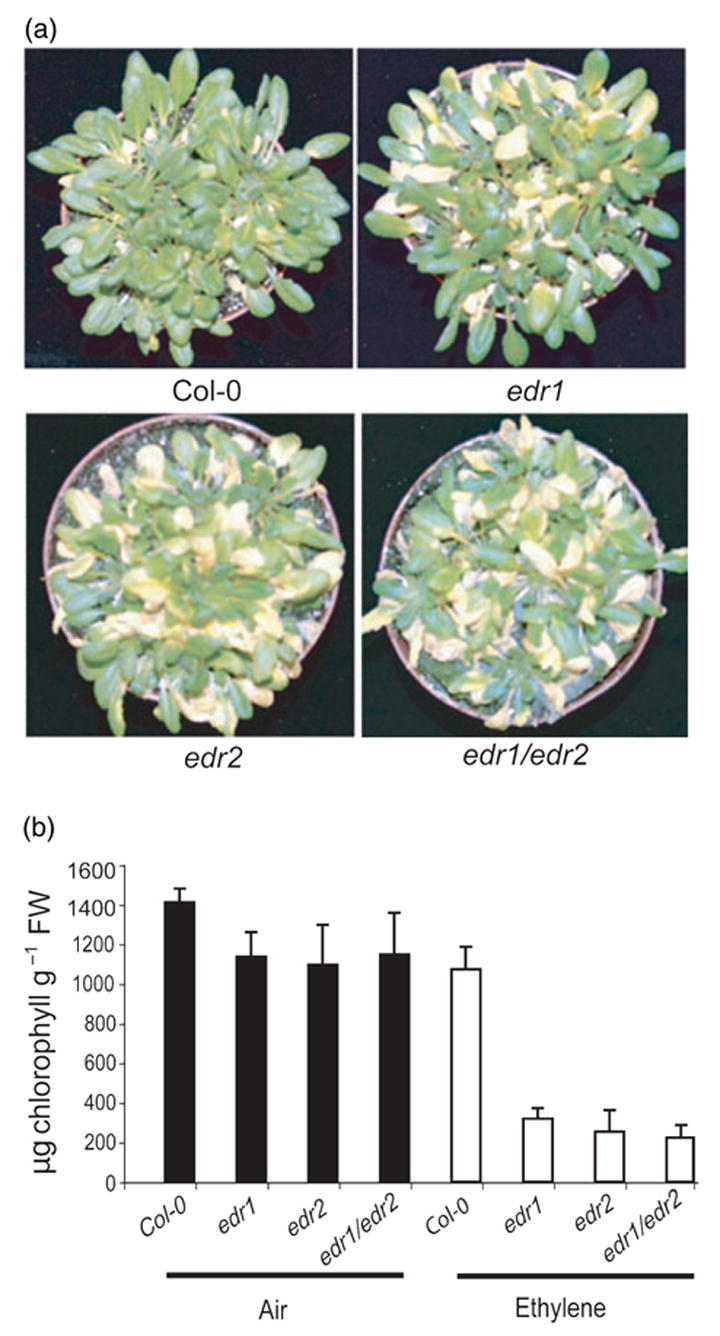
Enhanced ethylene-induced senescence in edr1 and edr2 mutant plants.
(a) Increased chlorosis after ethylene treatment. Plants were photographed after 3 days of exposure to 100 μl l−1 ethylene.
(b) The chlorophyll content in leaves five to eight (leaf one being the first true leaf) of the plants shown in (a). Bars represent the mean and standard deviation of values obtained from four plants.