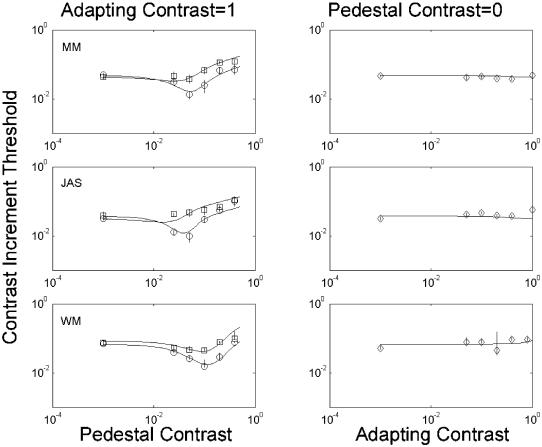
Figure 2.
Results of main experiment. Each row shows results for a different observer. The data points are the 82%-correct thresholds derived from psychometric functions, with error bars representing 95% confidence intervals derived from a bootstrap procedure. In the left-hand panels, circles show contrast-discrimination functions in the baseline condition without adaptation. The leftmost point is the detection threshold, at zero pedestal contrast. Boxes show thresholds obtained with a 100%-contrast adapting stimulus. The right-hand panels show how simple detection thresholds (vertical axis) vary as a function of adapting contrast (horizontal axis). The solid curves show best fits of a 6-parameter model, in which sensitivity and ‘filling in’ were allowed to vary with adapting contrast.

