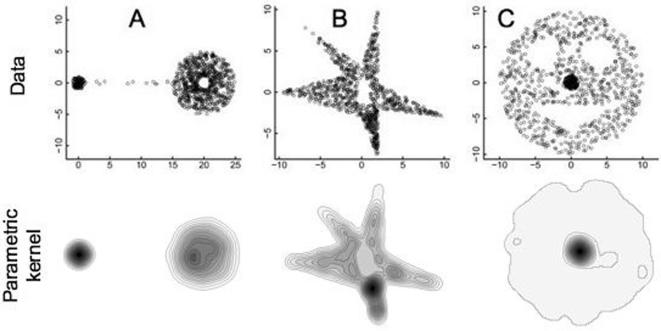
Figure 1.
The actual points used in the analysis, selected at random within boundaries defined in the methods to conform with the specified isopleth rules, are plotted here in the upper row for data sets A, B, and C. For each set, the 20% isopleth surrounds the densest aggregation of points that appear as relatively black areas in each of the plots. UDs constructed using the fixed kernel least-squares cross-validation method for these data are illustrations in the lower row (sizes have been adjusted to provide visual correspondence—where precise estimates of the fits are given in Table 1).

