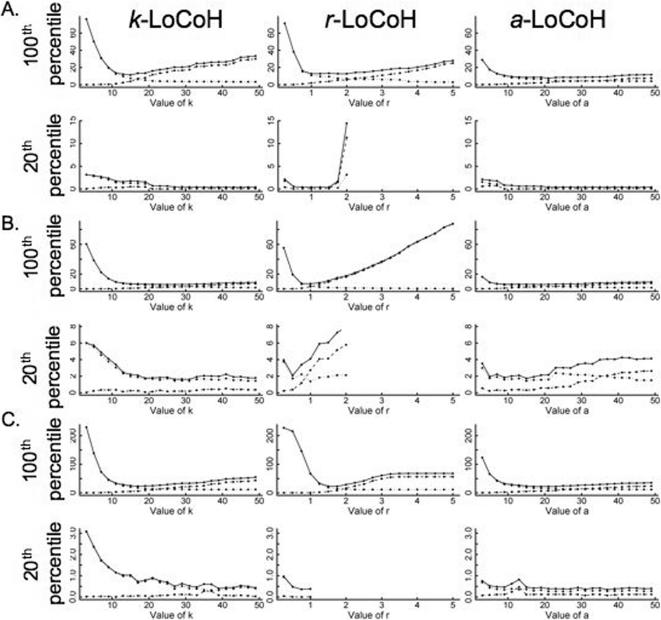
Figure 3.
Type I (dotted line), Type II (dashed line) and Total Error (solid line) (percentages) associated with the construction of 100% and 20% isopleths are plotted for the k-LoCoH, r-LoCoH, and a-LoCoH methods as a function of the parameters, k, r and a respectively for the three data sets (A, B, and C).

