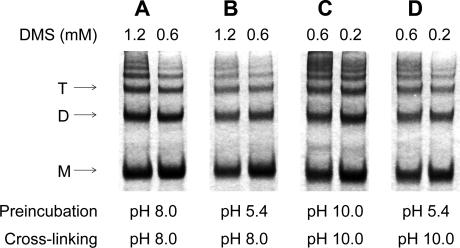
Figure 3. SDS-PAGE of TBE Virus Samples Cross-Linked with DMS at pH 8.0 and 10.0 without Pretreatment and after Pretreatment at pH 5.4.
(A and B) SDS-PAGE of TBE virus samples cross-linked with DMS at pH 8.0 without pretreatment (A) and after pretreatment at pH 5.4 (B).
(C and D) SDS-PAGE of TBE virus samples cross-linked with DMS at pH 10.0 without pretreatment (C) and after pretreatment at pH 5.4 (D).
DMS concentrations are indicated on top of the individual lanes. Staining was performed with Coomassie blue. Positions of the E monomer (M), dimer (D), and trimer (T) are indicated.

