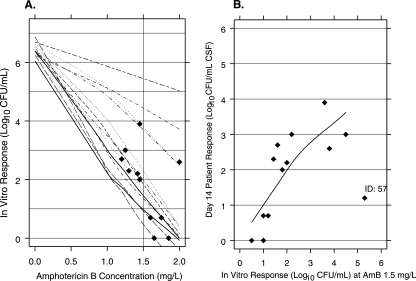
FIG. 1.
(A) Loess fit of the individual AmB concentration-response curve for each isolate using an in vitro inoculum corresponding to the baseline CFU per milliliter of CSF for each subject. A filled diamond shows the in vitro response matching the observed patient response at day 14, and the vertical line is drawn at 1.5 mg/liter of AmB, the estimated equivalent concentration. (B) Association between patient quantitative response at day 14 (vertical axis) and the in vitro responses to AmB at 1.5 mg/liter using patient-specific inocula (Spearman's rank correlation = 0.7 [P < 0.02]).

