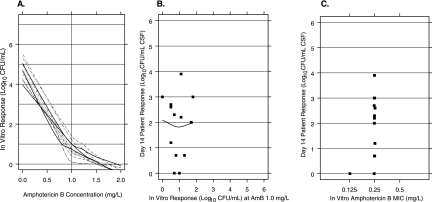
FIG. 2.
(A) Loess fit of the individual AmB concentration-response curve for each isolate using the standard inoculum (500 CFU/ml). The vertical line is drawn at 1.0 mg/liter of AmB, the concentration with the greatest range in the observed in vitro response. (B) Association between patient quantitative response at day 14 (vertical axis) and the in vitro responses to AmB at 1.0 mg/liter using the standard inocula (Spearman's rank correlation = −0.08 [P = 0.77]). (C) AmB MICs at 48 h.

