FIG. 2.
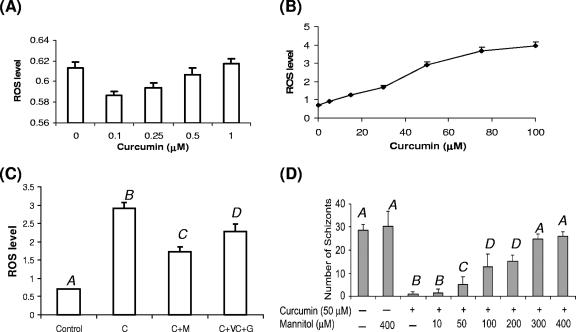
(A) Antioxidant activity of curcumin at concentrations of <1 μM. The y axis indicates the fluorescence intensity of the parasites after treatment with different concentrations of curcumin. (B) Concentration-dependent prooxidant activity of curcumin and elevation of intracellular ROS levels in P. falciparum. (C) Effects of antioxidants and mannitol on the attenuation of curcumin-induced intracellular ROS. C, 50 μM curcumin; C+M, 50 μM curcumin plus 50 μM mannitol; C+VC+G, 50 μM curcumin plus 1 mM vitamin C plus 1 mM reduced glutathione. Bars labeled with different letters indicate significant differences at P = 0.001 (Tukey's HSD test). (D) Effect of mannitol on curcumin-induced parasite growth arrest. The y axis indicates the mean number of schizonts from three replicate samples in 5,000 red cells, while the x axis indicates different treatments (+, present; −, absent). Bars labeled with different letters are significantly different (Tukey's pairwise t test, P = 0.05). Standard deviations were calculated from three experiments.

