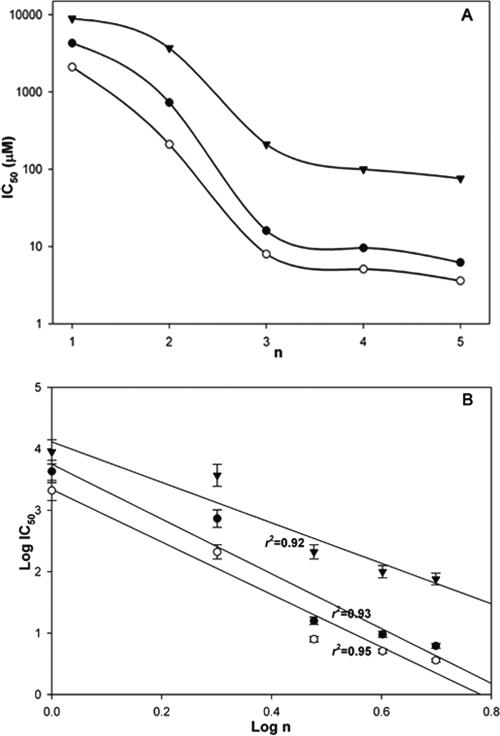
FIG. 4.
Correlation between antimicrobial activity and chain length of (RW)n-NH2 peptides. (A) Semilog plot of the data suggests a threshold effect in which short chains are inactive while chains longer than (RW)3 have roughly similar activities. (B) The data can be fit to a power law as well; y = cxa (where a and c are constants). Here we have log (IC50) = log (c) + a log(n) (n = 1, 2, 3, 4, or 5; IC50 is replaced by HD50 in the correlation for red blood cells). The slopes are −4.5 (r2 = 0.93), −4.3 (r2 = 0.95), and −3.3 (r2 = 0.92), for E. coli (solid circles), S. aureus (open circles), and red blood cells (triangles), respectively.

