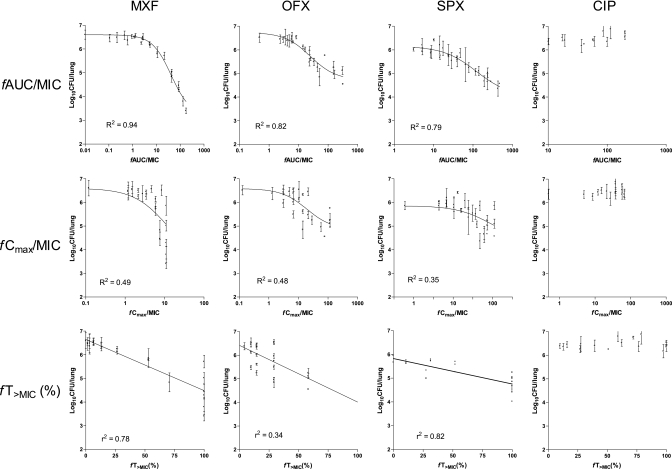
FIG. 5.
Relationship between fAUC/MIC, fCmax/MIC, and fT>MIC (percent) of the four fluoroquinolones and log10 CFU/lung of M. tuberculosis when the total dose is fractionated as per the design shown in Table 3. Each point represents the mean ± standard deviation of triplicate values.

