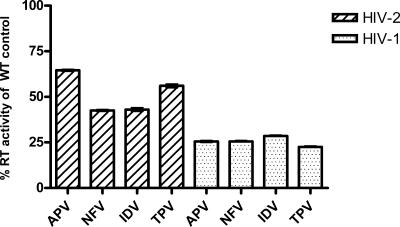
FIG. 3.
Relative levels of RT activity, compared to the wild type, of HIV-2 and HIV-1 variants serially passaged in the presence of PIs prior to the selection of resistance mutations. The results are expressed as the percentage of wild-type controls for HIV-1 and HIV-2, which, after 12 weeks, were 422,601 ± 50,410 cpm and 217,146 ± 20,008 cpm, respectively. Error bars represent the mean ± the SEM of the maximal RT activity of PI-selected viruses averaged per round of infection measured each week for 12 weeks. The HIV-2 values represent the means of all of the HIV-2 isolates in the present study (CBL-20, CBL-23, and MVP-15132), while those for HIV-1 represent isolate 5512.

