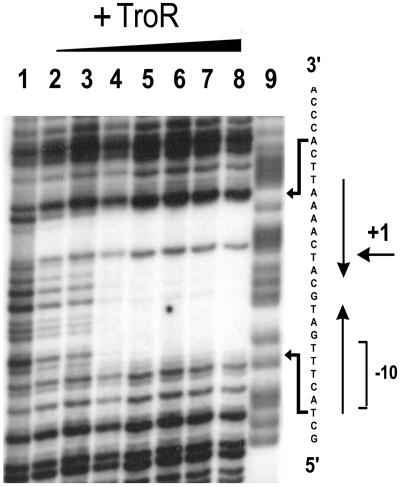
Figure 3.
DNase I footprint analysis of TroR. The autoradiograph of a 6% denaturing polyacrylamide gel showing the sequence of the troPO protected from DNase I digestion by TroR. Lanes 1–8 show reactions that contained increasing concentrations of TroR (0, 10, 20, 40, 60, 80, and 100 nM, respectively) in the presence of 100 μM MnCl2. G+A sequence ladder is shown in lane 9, and the sequence protected by TroR is shown on the right. The −10 region of the promoter is indicated on the far right and +1 indicates the 5′ end of the mRNA. The arrows denote region of dyad symmetry within the binding sequence.

