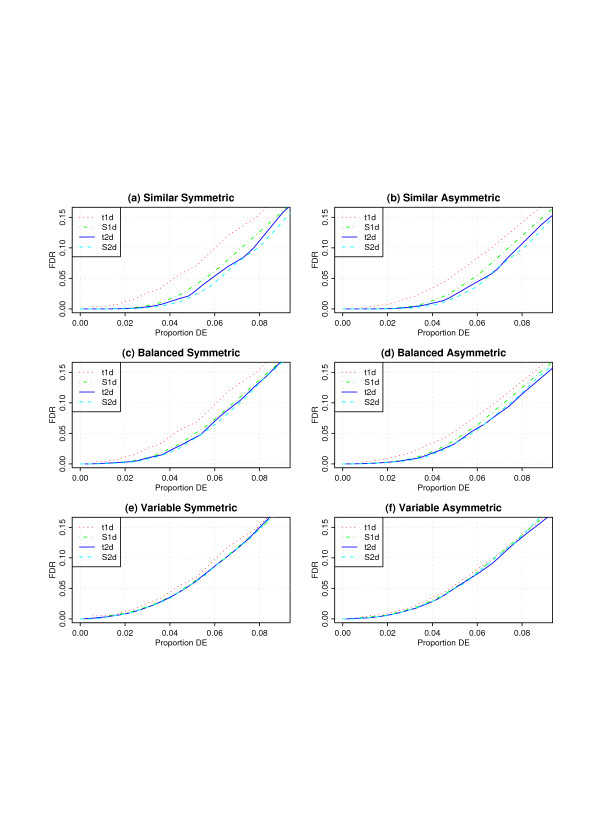
Figure 2.
Operating characteristics of the four procedures for six simulated data sets. Each curve shows the true global FDR among the top-ranked genes for a procedure on the vertical axis as a function of the percentage of genes declared DE by this procedure on the horizontal axis. See text for description of the simulation scenarios.

